How to Build an Executive Dashboard in Notion
A Complete Guide to Tracking Projects, Employees, Clients, Goals, KPIs, Workload, Meetings, Company Performance, and Business Operations in One Dashboard

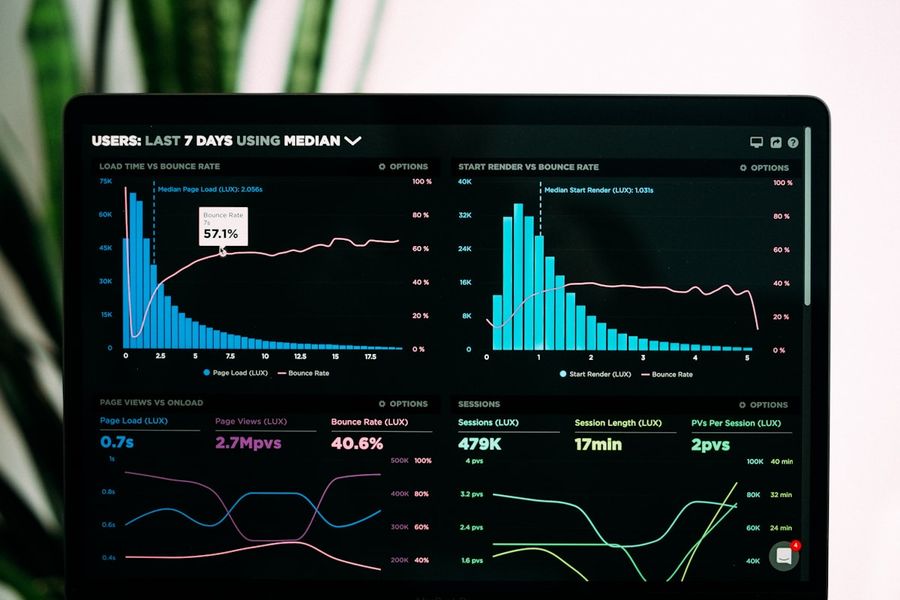
01Seven Tabs Open, Still No Real Answer
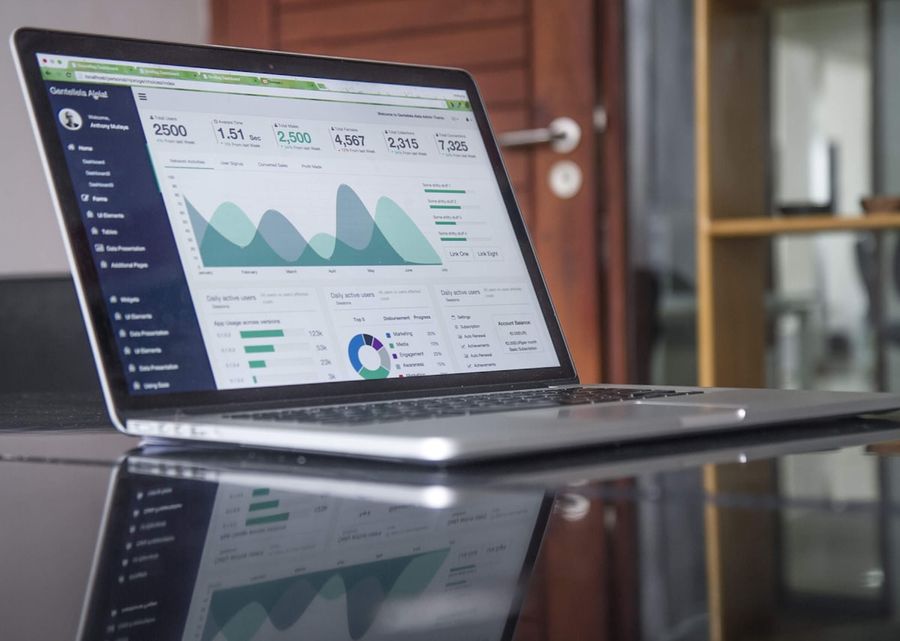
A CEO starts the morning by opening email, then Slack, then a project management tool, then a CRM, then a shared spreadsheet somebody built for tracking hiring, then the calendar, then a folder of shared documents nobody has fully organized. An hour later, they still cannot answer a simple question with real confidence: are we actually on track this month?
Information is scattered everywhere. A basic question about project status requires two follow-up meetings. Deadlines slip without anyone noticing until they've already passed. Managers spend real time each week manually assembling a status report that goes stale the moment it's sent. Leadership ends up spending more time searching for information than actually making decisions with it.
The fix here isn't more reports. It's one executive dashboard in Notion built on top of structured, connected business data, so leadership can see the state of the company in one place instead of reconstructing it from seven different tools every single morning.
The central idea worth holding onto throughout this entire guide: a dashboard should display information, not duplicate it. Every widget, every chart, every linked database view on the page should pull directly from a structured source of truth elsewhere in the workspace. The moment a dashboard becomes a place where someone manually types in this week's numbers, it has become just another spreadsheet wearing a nicer layout, and it will start drifting out of sync with reality the very first week someone forgets to update it.
The core architecture branches from a single executive dashboard into company KPIs, active projects, team workload, employee capacity, client health, meetings, goals and OKRs, revenue metrics, hiring, risks, upcoming deadlines, recent activity, department-specific dashboards, and a set of quick actions leadership can take directly. Every one of these sections needs to be connected to an underlying database, never manually updated, or the dashboard becomes exactly the kind of stale report it was built to replace.
02Section 1: What Actually Makes a Good Executive Dashboard

Executives generally need answers to a fairly consistent set of questions: are our projects on schedule, who on the team is overloaded, which clients need attention right now, what deadlines are coming up, which departments are falling behind, are we actually hitting our company goals, which risks need immediate attention, and simply, what should I focus on today.
A good dashboard is built around a small set of design principles. Clarity means every number on the page is instantly understandable without a footnote explaining what it means. Simplicity means resisting the urge to show everything just because it's technically possible to show it. Real-time visibility means the numbers reflect what's actually true right now, not what was true when someone last remembered to update a spreadsheet. Data accuracy means every calculation is trustworthy enough that leadership never has to double-check it manually before acting on it. Actionability means every piece of information on the dashboard connects to a decision someone could actually make, rather than existing purely as trivia about the business.
03Section 2: Design the Workspace Architecture First
Before building the dashboard itself, the underlying databases need to already exist and connect to each other properly: Employees, Departments, Clients, Companies, Projects, Tasks, Meetings, Goals, SOPs, a Knowledge Base, Risks, and Documents.
Picture this as a hub-and-spoke relationship. Projects relate to Clients and to a Team of Employees. Tasks relate to Projects and to an individual Employee Owner. Meetings relate to Projects and to Participants. Risks relate to Projects, Clients, or Departments depending on their type. Goals relate to Departments and to individual Owners. The executive dashboard itself creates nothing new; it simply pulls filtered, rolled-up views from every one of these existing databases into one page. If the dashboard is the very first thing being built, with no underlying databases in place yet, the actual work is building those databases correctly first, since a dashboard with nothing real to connect to is just a page full of empty widgets.
04Section 3: Build the Company KPI Section
Useful executive-level KPIs include the count of Active Projects, Projects at Risk, Completed Projects for the period, Open Tasks, Overdue Tasks, Active Clients, New Clients signed this period, Employee Utilization, overall Team Capacity, progress against Company Goals, Hiring Progress against open roles, a Customer Satisfaction indicator, and Average Project Completion Time.
Every one of these should be calculated directly from the underlying databases through a formula or a rollup, never typed in by hand. Active Projects is simply a filtered count of the Projects database where Status does not equal Completed or Cancelled. Overdue Tasks is a filtered count of the Tasks database where the Due Date has passed and Status is not Done. Employee Utilization can be calculated as a formula comparing hours logged against available hours per employee, then averaged across the team. The moment any of these numbers requires someone to manually type in a value each week, it has stopped being a KPI and become a chore that will eventually get skipped, and the dashboard will start silently lying to leadership the first week that happens.
Notion's native Chart view, added in 2024 and meaningfully expanded through 2026 with stacked-bar breakdowns and improved date grouping, can turn several of these KPIs into an actual visual trend rather than a single static number. A chart in Notion is fundamentally a view built directly on top of an existing database, so a bar chart showing Projects Completed by month, or a line showing Overdue Tasks trending down over the quarter, updates automatically the moment the underlying data changes, with no manual export or image refresh required. It's worth knowing the real limitations here directly: Notion's native charts can only pull from Notion's own databases, not from an external data source, they don't currently support multi-series line charts, and they offer limited custom styling compared to a dedicated business intelligence tool. For most executive dashboards built entirely on Notion's own data, this native charting capability is genuinely sufficient; businesses that need to visualize data living outside Notion, or want highly customized chart styling, typically look at a third-party embed tool or a dedicated BI platform instead. Native charts are available on paid Notion plans, so verify current plan requirements against Notion's own documentation before promising this specific capability to a client.
05Section 4: The Project Health Dashboard
Display Active Projects with their Status, Priority, Progress, Budget, Deadlines, any associated Risks, assigned Team Members, and Recent Updates, all pulled from the same Projects database described earlier.
Build this as several distinct views rather than one single table trying to do everything. A table view gives the most information-dense, sortable overview across every property at once. A board view grouped by Status shows projects moving through their lifecycle the way a sales pipeline shows deals moving through stages. A timeline view shows every project's start and end dates laid out against each other, immediately surfacing where two projects are competing for the same resources during the same window. A calendar view highlights specific milestone dates and deadlines directly on the calendar itself. An executive reviewing project health rarely needs all four views simultaneously; picking the one that answers the specific question at hand, schedule conflicts versus overall status versus a quick sortable list, is what makes this section fast to actually use rather than overwhelming.
06Section 5: The Employee Dashboard
Track each Employee, their Department, their Current Projects, their Assigned Tasks, an overall Workload indicator, their available Capacity, any scheduled PTO, relevant Certifications, their Manager, and their stated Weekly Priorities.
Build this primarily through filtered views rather than one shared master view everyone looks at together. A manager's view filters to just their own direct reports, sorted by current workload, so an overloaded team member stands out immediately without the manager having to scan the entire company roster to find them. An individual employee's own view filters to just their name, showing their current tasks and priorities for the week, which functions as a simple personal to-do list drawing from exactly the same underlying data everyone else's view also uses.
07Section 6: The Team Workload Dashboard
Visualize tasks grouped by employee, each employee's stated capacity, their upcoming deadlines, which team members are currently overloaded, how much available capacity remains across the team, and workload broken down by department.
A simple, effective version of this view groups the Tasks database by assigned Owner, with a rollup showing total estimated hours currently assigned to each person, compared directly against a Capacity property on their Employee record. Anyone whose assigned hours meaningfully exceed their stated capacity should visually stand out, through conditional formatting or simply sorting the view by that overage. This kind of visibility matters for more than scheduling efficiency; catching an overloaded team member before a deadline slips, rather than after, is also one of the more practical, low-cost ways to protect against burnout building up unnoticed over several consecutive weeks.
08Section 7: The Client Dashboard
Track Clients, their Companies, Active Projects, the date of the Last Meeting, an overall Health Status, their Renewal Date, any Outstanding Deliverables, and Recent Activity.
Account managers get the most value from a filtered view scoped to just their own book of clients, sorted by Health Status so anyone trending toward risk surfaces at the top rather than being buried among healthy accounts. A simple Health Status formula can combine a few underlying signals, such as time since the last meeting, any overdue deliverables, and recent sentiment noted in meeting records, into a single red, yellow, or green indicator that gives a fast read without requiring someone to read through every individual account's full history first.
At the executive level, this same Client database rolls up into a small number of company-wide numbers worth watching directly: total active clients, new clients signed this period, clients currently flagged yellow or red, and upcoming renewals within the next sixty to ninety days. This last number in particular deserves its own dedicated view, since a renewal that's allowed to arrive as a surprise, rather than being tracked with real lead time, tends to produce worse outcomes for both the business and the client than one an account manager has been actively managing toward for two months.
09Section 8: The Meeting Dashboard
Display upcoming meetings, meeting notes, decisions made, action items, and any outstanding follow-ups still unresolved from past meetings.
AI-generated meeting summaries can genuinely speed up this documentation, capturing a rough narrative and action items automatically rather than requiring someone to type notes by hand during the call itself. That said, anything feeding directly into a strategic decision on an executive dashboard, a specific commitment, a firm date, or a major client sentiment shift, deserves a human actually reviewing the AI-generated summary before it's treated as ground truth. An AI summary can smooth an ambiguous or hedged statement into something that reads more definitively than what was actually said, and an executive dashboard is exactly the wrong place for that kind of quiet distortion to go unnoticed.
10Section 9: Goals and OKRs
Track Company Objectives, Department Goals, their associated Key Results, current Progress, named Owners, and Due Dates.
Executives can review quarterly progress through a filtered view showing every current Objective alongside a rollup of its Key Results' average completion percentage, giving a fast read on which strategic priorities are genuinely on track and which are falling behind before the quarter ends rather than after. It's worth being direct about where Notion's own limits show up here: it works well for tracking a reasonable number of OKRs inside a small to mid-size team, with custom properties for deadlines, owners, and a formula-driven progress percentage, and that database can link cleanly into other pages for easy reference. Past roughly fifty employees, the open, modular structure tends to make visualizing dependencies between one team's key result and another's genuinely difficult, since there's no built-in tree view for that kind of cross-team alignment, and there's no automated check-in reminder system nudging every owner to update their own progress on schedule. Notion remains an excellent place to store and reference OKRs at almost any size; running the full structured OKR process, including scheduled check-ins and formal cross-team reviews, at real scale, typically calls for dedicated goal-tracking software once the organization grows large enough to need it.
11Section 10: The Risk Dashboard
Track Project Risks, Operational Risks, Resource Risks, Client Risks, and Compliance Issues, each with a defined Severity, an assigned Owner, current Status, a Due Date for resolution, and a documented Mitigation Plan.
A board view grouped by Severity gives leadership an immediate read on what genuinely needs attention right now versus what's simply being tracked and monitored. Every risk should have exactly one named owner responsible for its mitigation plan; a risk with no owner tends to sit untouched indefinitely, since nobody feels specifically accountable for resolving it, and it will keep appearing on the dashboard, unchanged, meeting after meeting, until someone is actually assigned to it.
Distinguish clearly between the different risk categories rather than lumping them into one undifferentiated list. A Project Risk, such as a deliverable falling behind schedule, generally needs the project's own team to resolve it. An Operational Risk, such as a single point of failure where only one employee knows a critical process, needs a documentation or cross-training fix rather than a project-level one. A Client Risk, such as a account showing signs of dissatisfaction, needs the account manager and possibly an executive directly involved. A Compliance Issue needs whoever holds that specific regulatory or contractual responsibility, and often needs to be escalated faster than the other categories given the potential consequences of leaving it unresolved. Keeping these categories visually distinct, whether through a property value or simply through separate grouped sections, helps route each risk to the right person immediately rather than dumping everything into one generic queue that nobody is quite sure who should be working through.
12Section 11: Executive Reporting Cadences
Build distinct sections for a Weekly Summary, a Monthly Review, Quarterly Planning, and Annual Goals, each pulling from the same underlying data at a different level of granularity and a different time horizon.
A Weekly Summary should be fast to scan: overdue tasks, this week's deadlines, any new risks, and recent client activity. A Monthly Review adds a broader trend view: project completion rate for the month, revenue metrics, and hiring progress. Quarterly Planning connects directly to the Goals and OKRs section, reviewing progress against the quarter's stated objectives and setting the next quarter's priorities. Annual Goals sits at the highest level, tracking company-wide strategic priorities across the full year. Building all four as different filtered time windows over the same underlying databases, rather than as four separate manually maintained documents, keeps them consistent with each other and up to date automatically as the underlying data changes.
Each cadence should also have a clear owner responsible for actually reviewing it, not just a page that exists and hopes someone opens it. A Weekly Summary with no assigned reviewer tends to quietly stop being checked within a month or two, at which point it has become one more stale artifact in the workspace rather than a genuinely useful rhythm. Assigning the Monday morning review to a specific person, even in a company where the founder does it themselves, keeps the habit alive in a way that simply having the page available never quite manages on its own.
13Section 12: Department Dashboards
Sales, Marketing, Operations, HR, Finance, and Customer Success each need their own dashboard, and a Leadership dashboard sits above all of them, rolling up the highest-level view across every department at once.
Each department's dashboard should display only what's genuinely relevant to that team, filtered from the same shared databases rather than duplicated separately. Sales needs pipeline stage, deal velocity, and recent client activity. Marketing needs campaign status and content pipeline progress. Operations needs resource utilization and vendor renewal dates. HR needs onboarding progress and open hiring pipelines. Finance needs budget tracking against project costs. Customer Success needs client health scores and renewal timelines. None of these require a separate system; each is simply a differently filtered lens on the same underlying data everyone else is also drawing from.
Resist building one dashboard that tries to serve every department at once. A single page crowded with sales pipeline stages, HR onboarding checklists, and finance budget variances competing for the same screen tends to be genuinely useful to nobody, since every viewer has to mentally filter out most of what's in front of them just to find their own relevant numbers. Six focused department dashboards, each drawing on a handful of filtered views from the same shared databases, serve the business considerably better than one crowded page trying to be everything to everyone. The Leadership dashboard sitting above all of them can then roll up just the highest-level number from each department, revenue from Sales, campaign performance from Marketing, headcount progress from HR, without needing to show every department's full operational detail directly.
14Section 13: Views
Linked databases let the same underlying data appear on multiple pages around the workspace without duplicating it, which is exactly what makes a single Tasks database useful simultaneously as a personal to-do list, a manager's team view, and a department-wide rollup. Filters narrow a view down to exactly the records relevant to whoever's looking at it. Groups cluster records by a shared property, such as grouping tasks by owner or projects by status. Sorts order records by priority, due date, or any other property that matters for the specific view.
Board views suit anything moving through discrete stages, such as a sales pipeline, a hiring funnel, or a project's lifecycle. Calendar views suit anything fundamentally organized around specific dates, like deadlines or scheduled meetings. Timeline views suit anything involving duration and overlap, like comparing several projects' start and end dates against each other. Gallery views suit anything better browsed visually, like a directory of team members or active clients with photos. List views suit a simple, information-dense, sortable overview when visual presentation matters less than raw scanability. Matching the view type to the actual question being asked, rather than defaulting to whichever view happens to look nicest, is what makes a section genuinely fast to use rather than simply decorative.
15Section 14: Dashboard Navigation
Design a clear path: the Executive Homepage links down into individual Department Dashboards, which link into specific Project Dashboards, which link into individual Task views, which connect to Employee Profiles, related Meeting Notes, and any relevant Documentation.
The goal is that anyone, from an executive to a front-line employee, can reach the specific piece of information they need in two or three clicks from wherever they currently are in the workspace, without needing to remember an exact page name or manually search for it. If a common question regularly takes someone five or six clicks and some guessing to answer, that's a sign the navigation structure itself needs to be redesigned, not that people need better training on where things are.
16Section 15: Visual Design That Serves Readability
Use icons consistently to help identify database types and page categories at a glance. Use page covers sparingly and consistently rather than as decoration that varies randomly page to page. Leave real white space rather than cramming every section edge to edge. Use callout blocks to highlight genuinely important information, not routine content that doesn't need special emphasis. Use dividers to create clear visual separation between distinct sections. Keep color usage consistent and meaningful, for example always using the same color to represent an overdue or at-risk status everywhere it appears in the workspace, rather than a different color scheme on every page.
The goal throughout is readability, not decoration. A dashboard that looks impressive in a screenshot but takes someone thirty seconds of visual parsing to actually find the number they need has failed at its actual job, regardless of how polished it looks.
17Section 16: Automation
Worth automating: weekly report generation, task reminder notifications, goal-progress updates, project creation from a template, and meeting follow-up prompts, along with dashboard refreshes wherever the platform genuinely supports triggering them automatically.
As of early 2026, Notion's native automation capabilities include database automations that trigger an action when a property changes within a single database, buttons that run a manual, multi-step action with one click, recurring templates that auto-generate pages on a defined schedule, and AI features that can summarize or autofill a property from page content, with the autofill feature generally requiring a separate AI add-on and running more slowly on larger databases. None of this executes true cross-application workflows or conditional branching on its own; anything that needs to reach outside Notion, or apply more complex conditional logic than a simple property-change trigger, generally still needs an external automation platform like Zapier or Make layered on top. Verify current native automation capabilities directly against Notion's own documentation before promising a specific automated behavior to a client, since this part of the platform continues to expand.
Prioritize automation effort based on where manual work currently costs the most time, not based on whichever automation happens to be easiest to build first. If a manager currently spends thirty minutes every Friday manually compiling a weekly status update from three different sources, that's worth automating well before a lower-value convenience like an automated reminder that saves someone a few seconds. A recurring template that generates the weekly report page automatically, pre-populated with live rollups from the underlying databases, can eliminate that thirty minutes entirely, leaving the manager to simply review and add commentary rather than manually assembling the numbers from scratch every single week.
18Section 17: Permissions
Executive-level access generally needs to see more than any single department, while each department typically only needs visibility into its own information plus whatever company-wide dashboards leadership has chosen to share broadly. Structure this through a combination of private pages for genuinely sensitive material, team spaces or sections with defined membership, and clearly labeled shared dashboards for anything meant to be broadly visible.
HR data, including compensation and performance reviews, and financial data, including detailed budget and revenue figures, deserve restricted access limited to the specific people who genuinely need it, not the default openness that's easiest to set up initially. Review this permission structure on a regular schedule, since access tends to drift wider over time as new people join and nobody circles back to tighten it again once the original setup is done.
A practical approach that scales reasonably well: give every employee access to the general company-wide dashboard showing non-sensitive rollups like overall project count and company goals, give department members access to their own department's dashboard and underlying databases, give managers access to their direct reports' detailed workload and performance information, and reserve the most sensitive HR and financial detail for a small, explicitly named group regardless of general seniority. Building permissions around what a role genuinely needs to do its job, rather than around general trust or tenure, keeps the system defensible even as the company grows and roles change hands.
19Section 18: The Mobile Dashboard
Executives frequently need to check the dashboard from a phone: during travel, between meetings, or for a quick daily review before the workday properly starts. Design the highest-priority views, overdue items, today's deadlines, and any urgent risks, to remain genuinely usable on a smaller screen, since a dense table with fifteen columns that reads perfectly on a laptop can become unusable on mobile.
A simple, mobile-friendly summary view, showing only the handful of numbers and flagged items that matter most for a quick daily check, complements the fuller desktop dashboard rather than replacing it. The goal on mobile is a fast, confident read of "is anything on fire today," not full analysis; save the deeper dive for whenever the executive is back at a proper screen.
20Section 19: Common Mistakes Worth Avoiding
Dashboard clutter from trying to display everything at once instead of what actually matters, tracking far too many KPIs until the meaningful ones get lost among the noise, manually updated numbers that quietly go stale within days, duplicate information maintained in two places that inevitably drift apart, poorly designed filters that show the wrong records without anyone noticing, weak or missing relations between databases that break rollups silently, no clear ownership over who's responsible for keeping a given section accurate, dashboards that were built once and never revisited as the business changed, and tracking everything the business could theoretically measure instead of specifically what leadership actually needs to make decisions.
That last point deserves particular emphasis, since it's the failure mode that undermines every other design principle in this guide. A dashboard with sixty KPIs is not more useful than one with twelve well-chosen ones; it's considerably less useful, because the twelve genuinely important numbers get buried among forty-eight others nobody actually checks regularly. Before adding any new metric to the dashboard, it's worth asking directly what specific decision that number would actually change, and cutting anything that doesn't have a clear answer.
21Section 20: Testing the Dashboard
Test the employee view, the manager view, and the executive view separately, confirming each shows exactly what it should and nothing it shouldn't. Test department-specific filters to confirm they actually scope correctly to the right team. Test the mobile layout directly on a phone, not just by shrinking a browser window on a laptop. Test permissions by actually logging in as a lower-access user to confirm sensitive information is genuinely hidden, not just assumed to be hidden. Test every KPI calculation against a manually verified example to confirm the formula is actually correct. Test that a project update made in one place, such as changing a task's status, correctly ripples through to every dashboard view that depends on it.
Build a simple testing matrix tracking the test case, the expected result, the actual result, and a pass or fail verdict, the same discipline that applies to testing any other business system, not just Notion specifically.
Pay particular attention to testing what happens when the underlying data changes, not just what the dashboard looks like in its current, already-populated state. Change a task's status from In Progress to Done and confirm the Overdue Tasks count updates, the relevant project's Progress rollup updates, and the assigned employee's workload view reflects the change, all without anyone touching the dashboard itself. This kind of ripple-effect testing is what actually proves the dashboard is genuinely connected to live data rather than a snapshot that happened to be accurate on the day it was built.
22Section 21: An Implementation Roadmap
Phase 1: business discovery. Identify what leadership actually needs visibility into before building anything. Phase 2: database architecture. Build or confirm the underlying Employees, Projects, Clients, and related databases are properly connected. Phase 3: dashboard design. Plan the overall layout and section structure of the executive dashboard itself. Phase 4: linked views. Build the specific filtered, grouped, and sorted views each section actually needs. Phase 5: KPIs. Define and build the formulas and rollups behind every metric on the dashboard. Phase 6: department dashboards. Build the role-specific dashboards for Sales, Marketing, Operations, HR, Finance, and Customer Success. Phase 7: testing. Confirm every view, permission, and calculation actually works as intended. Phase 8: training. Make sure leadership and every department actually understands how to read and use their own dashboard. Phase 9: optimization. Review what's actually being used, and what isn't, on a regular schedule, refining the dashboard as the business itself continues to change.
23A Complete Example: A CEO's Morning Review
Consider a professional services firm with forty employees across three offices. Before building an executive dashboard, the founder started every Monday by messaging three department heads individually, waiting for replies, then manually compiling their answers into a summary before the leadership meeting later that day.
After building the dashboard described in this guide, that same Monday morning looks different. The founder opens one page. The Company KPI section shows fourteen active projects, two flagged at risk, a 94 percent on-time completion rate for the month, and three overdue tasks, each linking directly to the specific task and owner. The Team Workload section shows one employee at 130 percent of stated capacity, flagged in red, with a direct link to reassign one of their tasks. The Client Health section shows one account trending yellow because it's been six weeks since the last meeting, with a one-click link to schedule a check-in. The Goals section shows the quarter's four OKRs, two comfortably on track and two behind, with named owners already visible. The Risk section shows a single high-severity item, a key vendor contract expiring in three weeks, with an assigned owner and a documented mitigation plan already in progress.
The entire review takes under ten minutes, and every number the founder sees is current as of that exact moment, not as of whenever someone last remembered to update a shared spreadsheet. The leadership meeting later that day starts from a shared, trusted picture of the business instead of three separate, slightly conflicting verbal reports.
24Measuring Whether the Dashboard Actually Works
Judge the dashboard by its effect on how leadership actually operates, not by how many widgets it contains. Worth tracking over time: how much time leadership spends each week manually requesting status updates, compared to before the dashboard existed. Whether decisions in leadership meetings now reference the dashboard directly rather than someone's personal notes or memory. Whether at-risk projects and overloaded employees get identified earlier than they used to, before a deadline is actually missed rather than after. Whether department heads trust the numbers on the dashboard enough to reference them directly in their own reporting, rather than quietly maintaining a separate spreadsheet they trust more.
That last signal matters more than it might initially seem. If department heads keep a personal, unofficial version of the numbers because they don't fully trust the shared dashboard, the dashboard has not actually succeeded yet, regardless of how it looks. The real goal was always a single, trusted source of truth; anything less than that is still, functionally, the scattered-tools problem this entire guide set out to solve, just with a nicer front page.
25The Bigger Picture
Many companies build a dashboard that's really just a list of projects with a status column attached. A properly designed executive dashboard is something considerably more useful: a genuine decision-making tool that surfaces exactly what leadership needs to know, when they need to know it, pulled live from the same structured data the rest of the business already runs on.
26How We Help
We help businesses with business discovery, KPI planning, database architecture, dashboard design, department dashboards, executive reporting, workspace optimization, user training, documentation, and ongoing improvements.
We call this an executive dashboard implementation for Notion, not simply a dashboard template, because the actual outcome is faster decision-making, genuinely improved visibility, and better operational awareness across the entire leadership team, built on data that stays accurate without anyone having to manually maintain it.
An Executive Dashboard Strategy Session can review your current workspace, identify your specific reporting gaps, assess your existing KPI visibility, evaluate your underlying database structure, map your department workflows, and identify the concrete dashboard opportunities that would actually change how quickly and confidently your leadership team makes decisions.
